This post is part 2 in my series #GAFE Impact Report, sharing data and analysis about student and teacher perceptions of the impact of Google Apps for Education. The results come from a 2014 survey I designed, implemented, and analyzed in my school. Be sure to check out Part 1: Overview & Infographic and Part 2: Comparing Surveys & Data. Though limited to my school, I believe these results to be informative and representative of many schools in the early stages of GAFE integration. Please share your thoughts and feedback on these posts, the survey, or the findings in the comments or on Twitter.
Data Summary
I like data. I could sit for hours building formulas, comparing charts, and analyzing the results of any given survey. And this is pretty easy with a Google form. That was exactly the plan last December when I intended to spend time working through the hundreds of responses for the survey. And then, of course, I got the flu. My analysis and conclusions took a lot longer than I would have liked but I’m happy with the results, both in the findings reached and my analysis, organization, and presentation.
For a nice organized Summary Report in a Google Doc, click here. This is what I shared and presented to my colleagues and administrators. In the future, I’ll write about more detailed results but the summary is plenty to get us started.
Below, I’ll highlight some of the key findings with selected graphics and data to back them up. Remember, the link above has much more detail if you are interested. I’m now eager to go through the process again to see how the findings have evolved as our tech integration and GAFE use has become a more regular part of instruction across the building.
- Students are learning from GAFE at OHS but through a range of different classroom experiences. Students report that only 37% of teachers use the tools regularly and 50% never use GAFE. Additionally, teachers are using many of the most effective apps only half as frequently as students.
- The use of GAFE is growing significantly. 58% of students think teachers are using GAFE more this year and 52% think it’s more important to their learning. Only 10% of students disagree with either of these statements.
- Some students and even more teachers are undecided about GAFE’s impacts. Few disagree with the positive benefits but teachers have an especially large undecided population--an average of 41%. Many teachers do not have enough experience or comfort with the technology and its classroom implementation.
- More students recognize the positive impact of GAFE when their teachers have received training to implement it in the classroom. Depending on the level of experience, positive results grew 5-9 percentage points.
- Only 35% of teachers feel prepared to use GAFE effectively in their classrooms. Both teachers and students report the need for teacher training and opportunities to learn to implement GAFE effectively. Almost all of the teachers say they need more training and access to learn how to use GAFE in classroom teaching and to become comfortable teaching with the technology.
None of these findings surprised me, but they did validate the work I, and many of my colleagues, were doing. GAFE was growing, seemed impactful, and training paid off. Still, it’s essential to recognize our challenges in training and access.
What Students and Teachers Think About GAFE & Learning
GAFE has a positive impact on students’ learning.
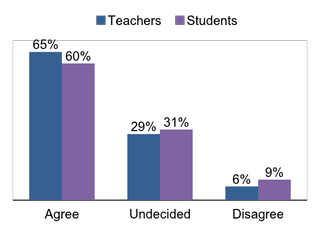
GAFE has a positive impact on teachers’ instruction.
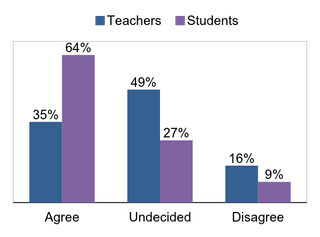
GAFE helps improve the quality of student work (in-school).
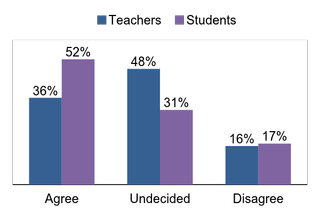
GAFE helps improve the quality of student work (homework).
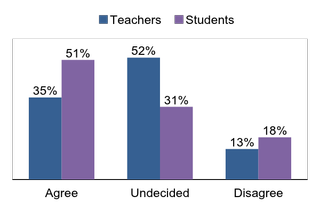
Needs Assessment: What Teachers Want
There are too many OHS teachers undecided about the impact GAFE has on teaching and learning. Many simply don’t have enough experience or practice with the technology.
- 77% Agree: I would use GAFE more if I had more training.
- 72% Agree: I would use GAFE more if I had more time.
- 42% Agree: I would use GAFE more if I had more access to the technology.
Next time, I'll explore in more detail what the teachers think and want in terms of access and training.
This data is just a taste of the many pages I collected. The full Summary Report highlights so much more, and I'm proud of the work that went into it and the results it shows. We made progress last year implementing GAFE with purpose but needed more access and more training for both staff and students. Too many teachers didn't have enough knowledge or experience to evaluate its impact and were undecided as a result. This year, we've addressed some of these concerns and so many more teachers are using Google Apps regularly. Maybe I'll even address how our current PD responds to some of these issues in a future post.
For now, please share your thoughts on the data, questions, or your school's implementation of GAFE in the comments or on Twitter.
cross posted at www.aschoenbart.com
Adam Schoenbart is a high school English teacher, Google Education Trainer, and EdD candidate in Educational Leadership. He teaches grades 10-12 in a 1:1 Chromebook classroom at Ossining High School in Westchester County, NY and received the 2014 LHRIC Teacher Pioneer Award for innovative uses of technology that change teaching and learning. Read more at The SchoenBlog and connect on Twitter @MrSchoenbart.

