Product review: LabQuest 2

By Carol S. Holzberg
Product: LabQuest 2
Vendor: Vernier
Website: http://www.vernier.com/
Retail Price: $329, LabQuest Replacement Battery (LQ-BAT, www.vernier.com/products/accessories/lq2-bat/), $19.
If I had a dollar for every time a vendor promised me that a particular software or hardware tool would raise student achievement, I could retire early. That said, some tools are very useful because they make learning more interesting, reduce the time required to perform mundane tasks, provide immediate feedback, and involve students in authentic problem-solving tasks to practice targeted skills. Vernier’s new LabQuest 2 handheld data collection interface is one such tool. It connects to over 70 optional probes and sensors to support STEM (Science Technology Engineering Mathematics) education and motivate self-directed learning.

Quality and Effectiveness
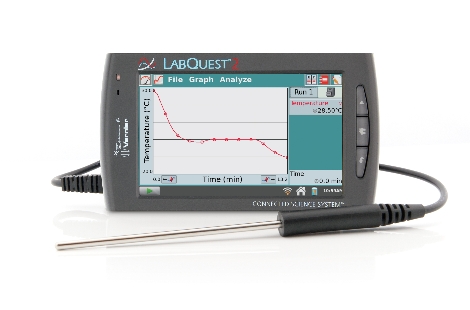
Vernier’s LabQuest 2 is an open-ended handheld tool that can be used to collect sensor data at a rate of 100,000 samples per second. Smaller than a Nook or a Kindle (albeit slightly bulkier), this 12-ounce touch tablet integrates graphing and analysis software for data gathering and visualization in STEM subjects such as physics, chemistry, biology, engineering and math. Students can use the device both indoors and outside, thanks to a high contrast color display mode option and LED backlight. Its rechargeable lithium-ion battery lasts about six hours for standalone work before it must be recharged with the supplied power adapter. You can also charge the LabQuest 2 when connected to a computer’s USB port.
Tools and ideas to transform education. Sign up below.
The 5-inch diagonal (2.625” x 5.3”) 800 x 480 pixel touch-sensitive resistive screen supports both landscape and portrait orientations. Users control the device with finger taps and swipes. A bundled stylus (which stores inside the unit when not in use) allows more precise selections, especially if you have long fingernails. The supplied tether lanyard keeps the stylus from getting lost.
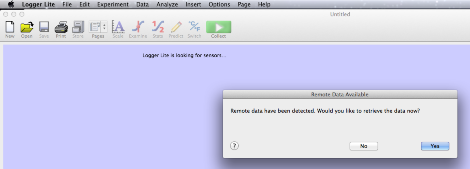
With two digital ports, a USB port, and three analog ports, the LabQuest 2 can collect data from dozens of connected sensors or a USB flash drive. The unit also has a built-in microphone, stopwatch, calculator and GPS, plus an 800 MHz application processor for data gathering. Its GPS can be used to record longitude, latitude, and altitude and does not depend on Wi-Fi connectivity. A mini USB port lets you connect the device to a Macintosh or Windows computer and transfer data to the supplied Logger Pro Lite software for viewing on the computer or further analysis, or to use the software directly with the LabQuest 2 and a connected sensor. Data can display in both table and graph.

LabQuest 2 also has jacks for an external microphone and headphones, a slot for a Micro SD/MMC card to augment its 200 MB internal storage capacity, built in Wi-Fi 802.11 b/g/n wireless and Bluetooth, and a DC power jack for use with the supplied external DC power adapter/battery charger.
Ease of Use
Preparing the LabQuest 2 for use couldn’t be simpler. Unpack the device, install the battery, use the supplied power adapter to charge the unit for about eight hours, and it’s ready to collect data. The LabQuest 2 comes with five built-in sensors for data acquisition. It features three accelerometers (X, Y, and Z), plus sensors for temperature and light. You can also connect an external sensor.
For optimal performance, you’ll want to personalize the LabQuest’s default settings. For example, you should calibrate the screen to ensure it responds to taps in locations you expect. You can also add a printer so that the LabQuest 2 will print a copy of a data graph, table, set of Lab instructions, Lab notes or the interface screen itself. LabQuest 2 prints to HP printers using Wi-Fi or USB (with the supplied USB cable). If you have a Macintosh and an installed copy of ecamm’s Printopia (http://www.ecamm.com/mac/printopia/), the device will print to a non-Wi-Fi enabled network printer such as the LaserJet 4240n.
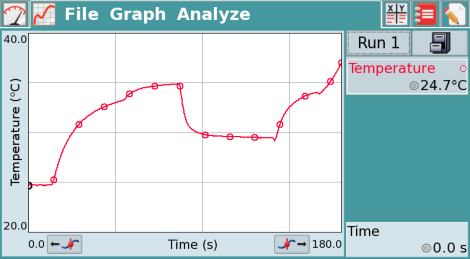
The unit’s built-in software offers many options for data collection, viewing and analysis. For example, users can choose how many samples the device collects over how long an interval, and how long the sampling run should last. Similarly, when viewing data displayed in the graph you can use the stylus to drag across a data range and perform tasks like curve fits, Delta, integrals, and descriptive statistics (e.g., minimum, maximum, mean, and standard deviation). You can also collect data in multiple runs for comparison. It will take time to explore all options and become comfortable with how to use them.
Creative Use of Technology
LabQuest 2 integrates Wi-Fi, support for Vernier’s Bluetooth WDSS (Wireless Dynamics Sensor System), and USB. It integrates software for data gathering, visualization and analysis allowing students to email, print, and share sensor data as needed. Collected data can be sent as a PDF graph, a data table text file for importing into Excel, Numbers or another spreadsheet, or a screen capture for use in reports and science journals (see below). Data can also be imported into the computer and opened with Logger Pro Lite for further analysis.

Applications installed on the handheld device include a built-in periodic table, stopwatch, scientific calculator, on-screen keyboard, and more than 100 preloaded lab instructions from Vernier lab books (including experiments involving water quality testing, electricity, diffusion through membranes, cell respiration, photosynthesis, soil moisture, indoor CO2 levels, and much more). Printable instructions on the handheld explain which sensors to use and what procedures to follow.
Suitability for Use in a School Environment
Current Common Core State Standards (CCSS) integrate Science & Technical Subjects with standards for English Language Arts requiring students in grades 6-8 to do the following:
- Follow precisely a multistep procedure when carrying out experiments, taking measurements, or performing technical tasks [RST.6-8.3]
- Integrate quantitative or technical information expressed in words in a text with a version of that information expressed visually (e.g., in a flowchart, diagram, model, graph, or table) [RST.6-8.7]
- Compare and contrast the information gained from experiments, simulations, video, or multimedia sources with that gained from reading a text on the same topic [RST.6-8.9].
These standards reappear in grades 9-12, but students are expected to assume greater responsibilities as tasks become more complex (RST.9-10.7).
High school biology and chemistry teachers in the Greenfield, Massachusetts Public Schools use Vernier's first generation LabQuest with several probes and sensors in both regular and AP science labs. In Aquaculture, for example, students combine plants, invertebrates and fish in bottle aquariums, then they use the LabQuest with carbon dioxide probes to monitor changes in carbon dioxide, turbidity, oxygen, nitrates and other substances. Students often transfer data from the LabQuest to a desktop computer or a USB flash drive then transfer their data to Microsoft Excel for further analysis. One student used a voltage probe to measure the electrical output of bacteria in an estuary environment.
Greenfield’s chemistry students use the LabQuest with Vernier’s SpectroVis Plus probes to gather data for creating a standard curve. In one experiment, students measure protein concentration in milk and other high protein drinks. In another experiment, they monitor enzyme reaction rate under varying conditions, such as pH or temperature, based on a color change. They also use temperature probes in both lab and independent science projects to monitor changes in temperature over time. In a sustainable energy class, students observe the emission spectrum of various light sources, such as fluorescent and incandescent lamps, using Vernier’s SpectroVis Optical Fiberinsert to convert the SpectroVis Plus spectrophotometer into an emissions spectrometer.
The LabQuest 2 can help with all of this and much more at no additional charge. For example, while the first generation interface comes with several ports (including two digital, four analog, one USB, an SD/MMC card slot), its 416 MHz application processor is about half as fast as the 800 MHz ARMv7 Processor that ships with the LabQuest 2. Similarly, the first generation LabQuest has only a 320 x 240 pixel color touch screen, merely 40 MB RAM for storage and lacks Bluetooth and Wi-Fi capabilities. LabQuest 2, on the other hand, boasts 200 MB of RAM, and almost twice the display resolution. LabQuest 2 also features support for Vernier’s Connected Science System allowing users to share data using the built-in Data Share software by connecting the handheld to any device (including iOS and Android) with a compatible Web browser.
OVERALL RATING
Vernier’s LabQuest 2 can build interest in science, make experiments come alive, and deepen understanding of complex concepts. The affordable handheld tool supports student-centered, inquiry-based learning, high-end data collection, and critical analysis as budding scientists use real tools to conduct real-time investigations of natural phenomena. It comes with 100 prepared Labs (complete with instructions), enabling teachers to maximize instructional time by integrating engaging extension activities that correlate with targeted curriculum. Finally, it comes with a 5-year warranty (only one year on the battery), a stylus tether, a long-lasting rechargeable battery, Wi-Fi for connectivity, print capabilities, and much more.
Top three reasons why this product’s overall features, functionality, and educational value make it a good value for schools
- Compatible with over 70 sensors and probes for real-time data collection (over short or long periods of time) and analysis
- Built-in graphing and analysis software to visualize and make sense of complex data
- Works stand-alone (with built-in Wi-Fi to simplify data sharing and printing) or with a computer
About the Author: Carol S. Holzberg, PhD, cholzberg@gmail.com (Shutesbury, Massachusetts) is an educational technology specialist and anthropologist who writes for several publications and works as the District Technology Coordinator for the Greenfield Public Schools (Greenfield, Massachusetts). She teaches in the Licensure program at the Collaborative for Educational Services (Northampton, MA) and the School of Education at Capella University. As an experienced online instructor, course designer, and program director, Carol is responsible for developing and offering training programs and support for faculty and staff on technology for teaching and learning. Send comments or queries via email to: cholzberg@gmail.com.
