How to Develop Data Literacy in Elementary-Aged Students
By promoting reasoning and sense-making, data literacy can provide a way for a meaningful integration of math and science while developing critical thinking skills

Tools and ideas to transform education. Sign up below.
You are now subscribed
Your newsletter sign-up was successful
We are living in a data-saturated world. In fact, 90% of the world’s data has been produced in the past two years and the fastest-growing qualification for new jobs in the STEM field is data capabilities.
Knowing how to make sense of graphs and ask questions of data is a capability that educators must help their students develop. And yet, the teachers I work with often lament about their students’ inabilities to draw conclusions, reason, and make sense of data.
The good news is that it’s not too late (or too early, in this case) to start developing data literacy with your students. And the data talks approach might just be the way to develop these skills in your students in a way that works with the time constraints in your instructional schedule.
How are we falling short in helping students become data literate?
To start, oftentimes due to curriculum pacing and lack of instructional time, math teachers present data concepts in isolation and out of context. Therefore, instruction becomes very procedurally oriented.
For example, students view the process of doing statistics as one in which they just have to follow the right steps to find the number in the graph that correctly answers the question. However, data is not just numbers in a graph; data is numbers in context. While students may become skilled at finding the right answers by learning a procedural method, they may not be able to really explain what the numbers mean. By providing students with a premade set of data and data visualizations (graphs, charts, etc.), we withhold from them the opportunity to think critically and do the intellectual reasoning of making sense of the data.
Sadly, teachers of STEM subjects can also do students a similar disservice. As a science teacher, I know that it's important for my students to plan and carry out scientific investigations that produce data, and then use data to make scientific claims. However, if I’m pressed for time, I might skip over the data analysis stage and simply provide the scientific explanation myself. By withholding this opportunity for students to compile and grapple with the data themselves, they are unlikely to develop a full understanding of the science concepts we are studying.
Enter ... data talks
A data talk is a discussion-based approach that takes best practices in teaching from both mathematics and science (i.e. implementing tasks that promote problem-solving and reasoning, establishing claims from evidence in science) and combines it all within a structure that is engaging and inviting. It allows the teacher the opportunity to integrate across both mathematics and science disciplines, which can help develop reasoning skills.
Tools and ideas to transform education. Sign up below.
A data talk begins by presenting students with a data visualization that they can relate to. The visualization should rely on their prior knowledge and tap into their curiosity. After giving students time to linger within the graph or data visual looking for patterns, the teacher then invites them to share what they notice and what they wonder about the data.
The open nature of this invitation supports all students in believing their ideas are valuable. Doing this affirms learners’ identities, which is one of the NCTM’s five equity-based practices to support mathematics learning. So now, students are not only growing their critical thinking and reasoning skills, they are growing a positive identity as a mathematician, scientist, and STEM practitioner. Win-win-win!
Finally, through rich academic discourse, students collectively grapple with the data to look for evidence to support their claims. The communication portion of the data talk allows students to boost their oral language skills. Students can use the academic vocabulary specific to the mathematics and science units of study while they develop their competencies in speaking and listening.
All in all, within a data talk, you are addressing math, science, and literacy/language skills--a great way to teach multiple skills within one lesson, saving you instructional time while boosting your students’ data literacy power.
This process can be summarized in four steps:
- Questioning
- Pattern seeking
- Meaning making
- Communication
The flow of this structure also supports what cognitive scientists recognize as the three steps in information processing: input, elaboration, application.
Data talks can lead to scientific investigations


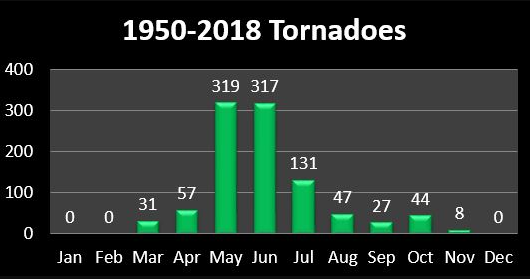
I recently facilitated a data talk with a class of fourth graders who were in the middle of their science unit of study on weather. I presented students with a bar graph (above) showing the number of tornadoes occurring in Kansas each month for the past 70 years. Students quickly noticed that the most tornadoes occurred during the summer months (May-319, June-317, July-131). They also noticed that no tornadoes occurred in the winter months (December, January, and February).
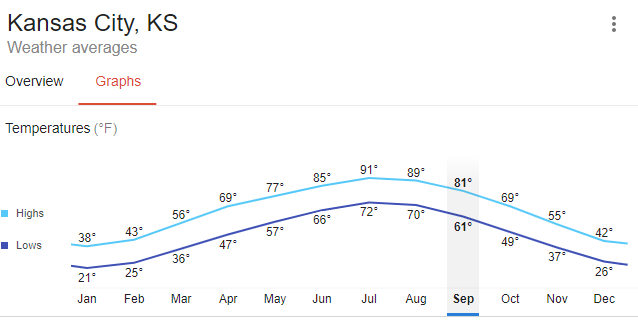
Many students wondered why there was such a difference in the number of tornadoes occurring at different times of the year. Some students inferred that the reason why tornadoes didn’t occur in the winter was because it was too cold for them to form. We then compared the bar graph of tornadoes by month to a graph showing the high temperatures by month. Students could see a clear correlation between the two graphs. The openness of this approach encouraged curiosity and motivated students to find answers to their questions.
I told students that in order to test their claims, we would need to learn more about the conditions that were needed for a tornado to form (one of our science objectives for the unit of study). Next, students spent some time exploring the tornado simulation in the Discovery Education Science Techbook. Students explored by selecting different types of air masses to meet and observed whether or not a tornado was formed.
What students discovered from the Techbook investigation validated their data-based claim. They found that warm, moist air rising through cold, dry air can create a funnel of fast moving air, and were able to conclude why the data showed no tornadoes occurring in Kansas during winter is because the air is too cold and dry for tornadoes to form.
Through this short lesson students not only learned about an important science concept (how tornadoes form), but they also started to develop important dispositions that are helpful to a data scientist:
- Approach data with a curious eye
- Always think carefully about the context of the data
A simple structure to support complex thinking
A data talk is a simple structure that can elicit complex thinking. Facilitating one is much like facilitating a number talk in mathematics, or the explore phase of a 5E model science lesson. Selecting the right data visualization might be the most challenging part for the teacher, but once you have the right one it will serve as the catalyst for rich student discourse.
The beauty of the openness of the data talk is that it helps students see the process of data analysis as interesting and investigative. As economist Steve Levitt said, “Data science...opens up...ways for children to become the discoverers of knowledge, as opposed to the recipients of the brilliance of past generations.”
To learn more about data talks and other ways to promote data literacy, check out:
https://www.youcubed.org/resource/data-talks/
Data Literacy 101: What can we actually claim from data Science Scope—February 2020 (Volume 43, Issue 6) Kristin Hunter-Thomson
M. Ryan Foster is currently the Elementary Science Coordinator for Virginia Beach City Public Schools. In his 16 years in VBCPS, Ryan has also served as a fifth-grade teacher, Title 1 math specialist, and STEM camp administrator, and is a member of the Discovery Educator Network’s DEN Leadership Council.
