Wikipedia vs Library: Analysis of an Infographic
In my own PLN, one of us discovers an infographic relevant to learning or libraries or research and it’s all over the edtech/library world in a matter of minutes. And many of us are now using infographics as a student assessment. But, like political or commercial messages, infographics are carefully crafted media messages. And they beg careful deconstruction, scrutiny, and analysis.


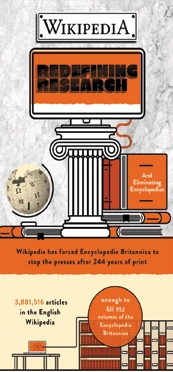
The infographic, Wikipedia: Redefining Research, for instance, appeared on Open-Site recently. It documented the end of Britannica’s long print-based history and Wikipedia’s growing prominence as a reference source. As I looked carefully at the infographic, as I really read it, I began to see some distorted truths and some opportunities for information literacy explorations.
Some of the statistics presented:
• Students use Wikipedia more than libraries. Only 25% of students visit the library but 8 in 10 students turn to Wikipedia for their first source of research.
• Library use is declining by 11% annually. And the amount of books is declining by 12%.
• 1.59 visits to the library annually. 5.7 billion visits to Wikipedia annually.
The source for the statistic regarding decline in library use comes from a November 18, 2010 article in the Concord (NH) Monitor. And that Concord article actually notes that despite the decline in use seen in two local branches, libraries across the nation have seen more people using their services in recent years due to the recession.
In the statistic comparing library visits to Wikipedia visits, the creators also quoted an IMLS study, based on a 2009 survey, using it to compare 1.59 billion library visits to 5.7 billion visits to Wikipedia. While that may be true, it seems a bit of an apples vs. oranges comparison. And, in fact (ironically), the original source uses the 1.59 billion number to report an increase in library visits.
Other questions to ask relating to this infographic:
• Which libraries were you measuring?
• Which students? Which teachers?
• Are those students who may not visit the public library visiting their school libraries–either physically or virtually–during the school day?
• Did you explore the digital use of public, school, or college libraries? Students now use library resources even when they are not physically in their libraries.
• Does YouTube give Wikipedia a run for its money?
• And is there an irony–a rather sad one–about the authors titling their own infographic “Research Redefined”? While the authors of the infographic may have used a few reliable sources, in my mind, their own research is a little shoddy. I would have expected more of my own students.
Joyce Valenza is the Teacher-Librarian at Springfield Township High School, author, and technology advocate. Read her SLJ NeverEndingSearch blog here.
