Using Data for Better Learning with #GoogleForms

Data-driven instruction is one of those buzzwords in today’s educational landscape. We hear all about data, but if your experience is anything like mine, you’ve never really been trained to do much with it.
Sure, we give pre-assessments and set goals for post-assessments, growth, and student success, but it often feels like we’re doing so only to play (and win at) the game of public education. Of course I want my students to succeed--but I want to facilitate authentic opportunities to help them learn and grow, not meet arbitrary growth standards set outside my classroom or school--or any school at all.
Most of my data-driven experiences haven’t really been about student learning in the past, but I do value data--we need to be able to communicate learning and growth--so I set out to find easy strategies to use it more meaningfully this year. Sometimes we see learning in a look, a gesture, or a smile, but other times it takes writing or numbers to better describe, qualify, and quantify that growth.
As we gear up towards the end of the school year and my students prepare for their final exams, I used Google Forms more and more to formatively assess learning and growth and to better plan my teaching and reteaching. With a really simple Google Form, I could track success and growth, and use data to drive my instruction to best meet my students needs.
The Form: What, Why, and How
The assignment and practice that sparked this idea and post was a Common Core Reading Comprehension multiple choice section. This practice and growth on it was important for us because it’s part of the standards and my final exam. More importantly, reading comprehension and analysis is an important life skill (although I wish education didn't rely on multiple choice assessment so often--but that's a different conversation). Feel free to substitute your own content or skill-based concept; any sort of checklist or multiple choice questions will work well. This could range from multiple choice, rubric feedback, assignment guidelines, peer evaluation, and so much more.
My students completed the reading comprehension practice at home. I then sent an answer key to them using Remind and Google Classroom. After they scored themselves, they logged their wrong answers and total number correct in a Google Form. You can find a public copy of the most recent version here.
The form asks for the total number of correct answers, which questions students got wrong (checkbox style--select all that apply), how long they spent on the practice, and which type of questions they had trouble with. This time, I added a paragraph text box to ask students what they still wanted to review. Sometimes I’ll separate the questions by passage for easier analysis. The form only take a few minutes for students to fill out but provides us all with valuable data.
Tools and ideas to transform education. Sign up below.
Click here to make a copy of my form.
The Data: Summary of Responses
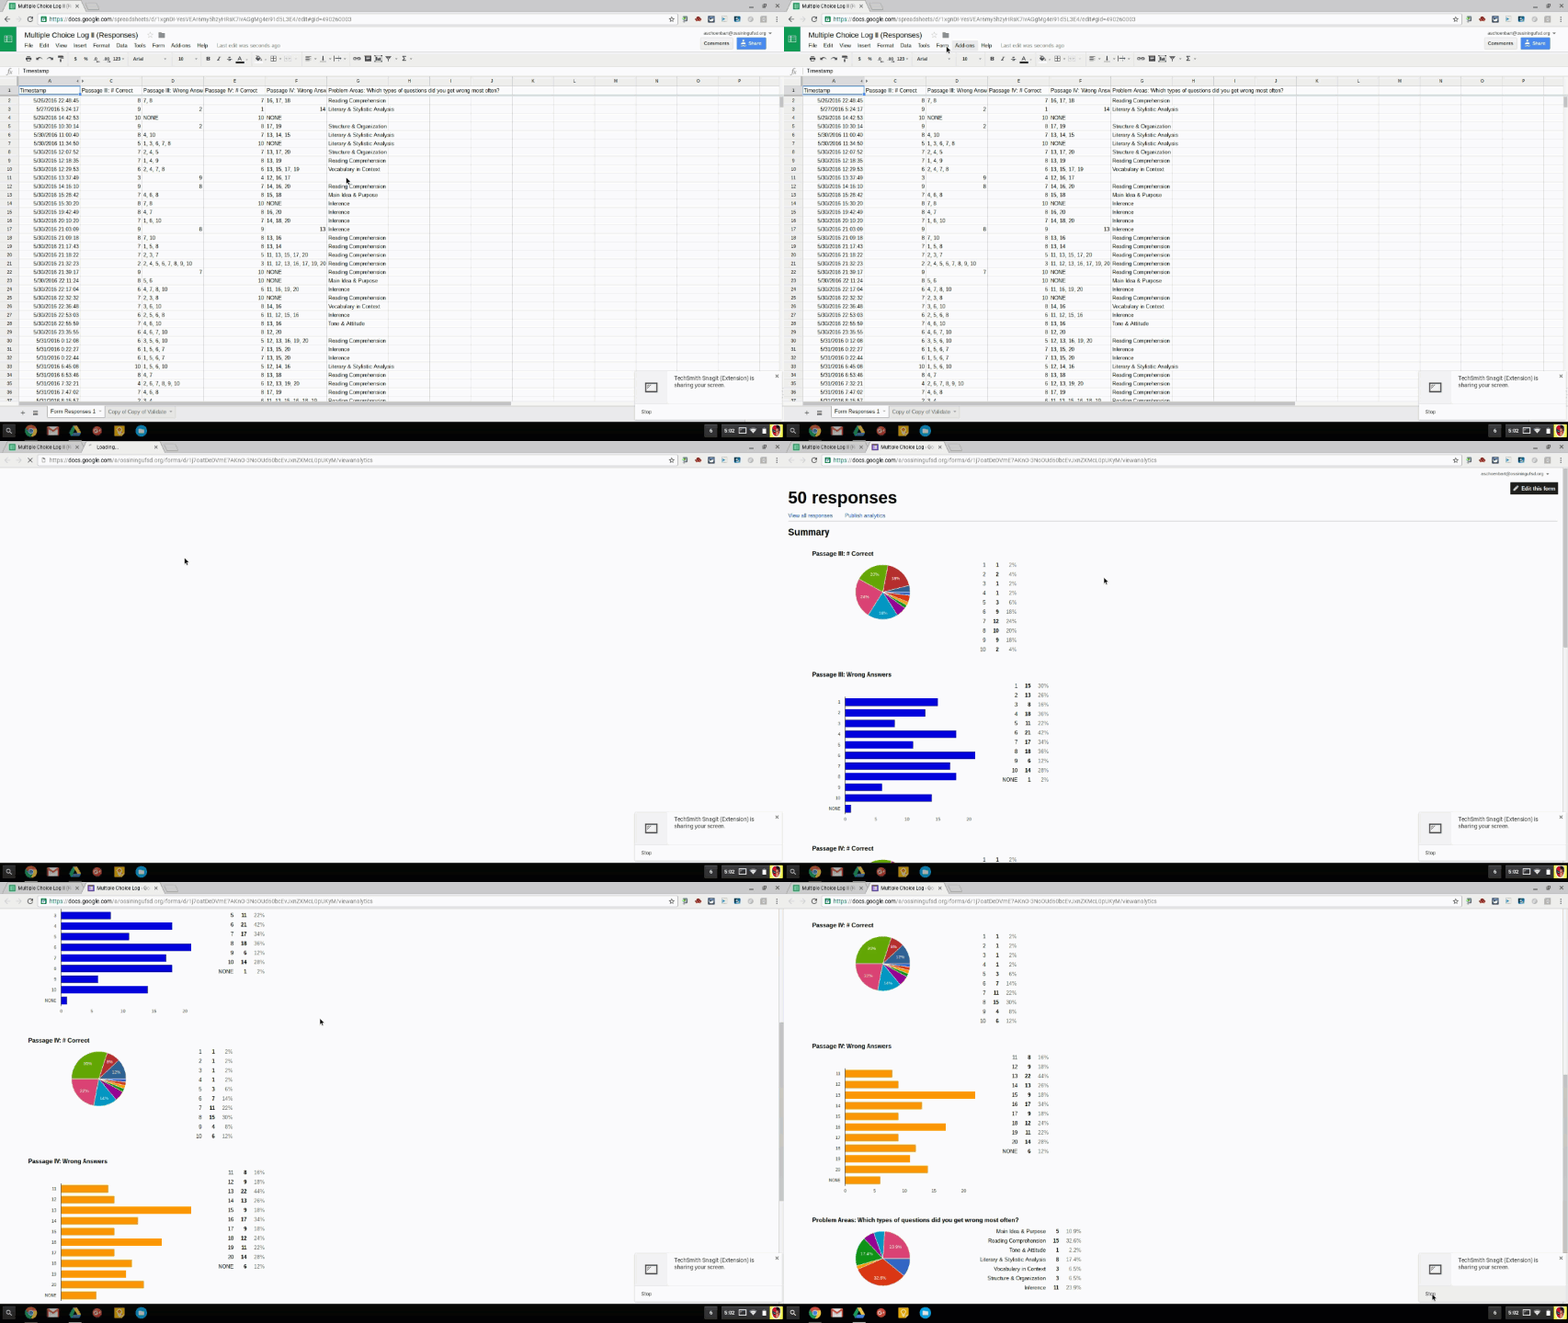
The Google Forms Summary of Responses is a beautiful tool. With a click, it provides easy and effective data analysis, and it does so automatically. See the animated GIF below to see how if you haven’t used this feature before. It’s a game changer.

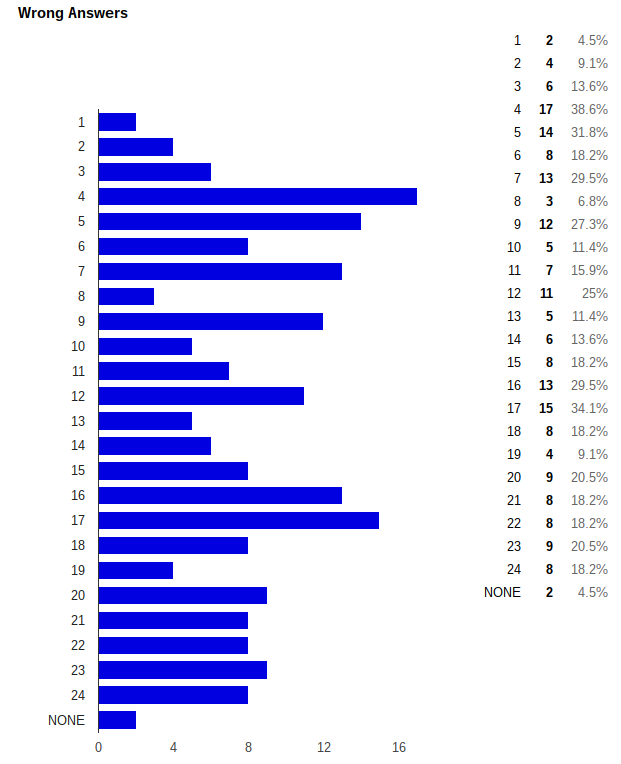
Now, when I needed to clarify problematic questions, I knew which ones they were. I didn’t have to rely on a handful of student volunteers that may or may not represent the whole class nor did I have to painstakingly review every student’s work. This data was for them more than it was me--it was to push their learning forward. It helped us see our common strengths and weaknesses and collaborate to grow. I shared screenshots from the summary online and asked students to select the hardest questions and troubleshoot them.
Then, we analyzed the types of questions and what they were asking for to find trends in the data. As a class, we were able to practice multiple choice skills and troubleshooting, all while improving our own understandings. The graph below is my favorite visual aid to help communicate its power; I not only know where my students need help but I can track their growth and improvement, too. All with the data to prove it.

Data Driven Change
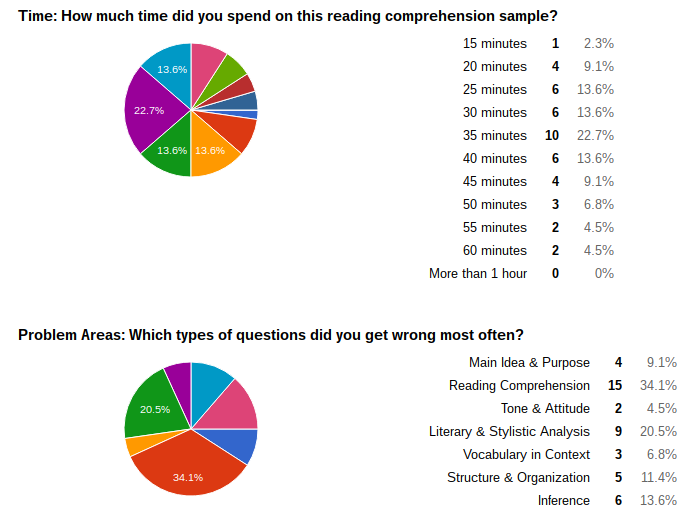
With this data, I can better adapt my lessons and instruction to meet students needs. I can use graphs like the ones below to address time management or analyze question types, and tailor my class time to instruction that is more effective and purposeful with this data and assessment.

Next year, I plan to do more formative check-ins like this to drive instruction. I used A LOT of Google Forms this year, and often asked students for feedback, but I don’t think I let the data inform our work to the fullest extent. I never want data or technology to get in the way of a conversation with a student--and it can never replace that smile or look that shows real learning and achievement--but it can provide tools to give us more information about student learning than ever before. And when we know better, we can do better.
How do you use data in your assessment and instruction? Share your strategies and experiences in the comments or on Twitter.
cross posted at www.aschoenbart.com
Adam Schoenbart is a high school English teacher, Google Education Trainer, and EdD candidate in Educational Leadership. He teaches grades 10-12 in a 1:1 Chromebook classroom at Ossining High School in Westchester County, NY and received the 2014 LHRIC Teacher Pioneer Award for innovative uses of technology that change teaching and learning. Read more at The SchoenBlog and connect on Twitter @MrSchoenbart.
