6th graders, under the facilitation of their Math teacher, Laurel Janewicz, have learned to take data, analyze the data and tell a story with it. They are demonstrating their understanding of Math concepts, data graphs, misleading graphs and communication skills.
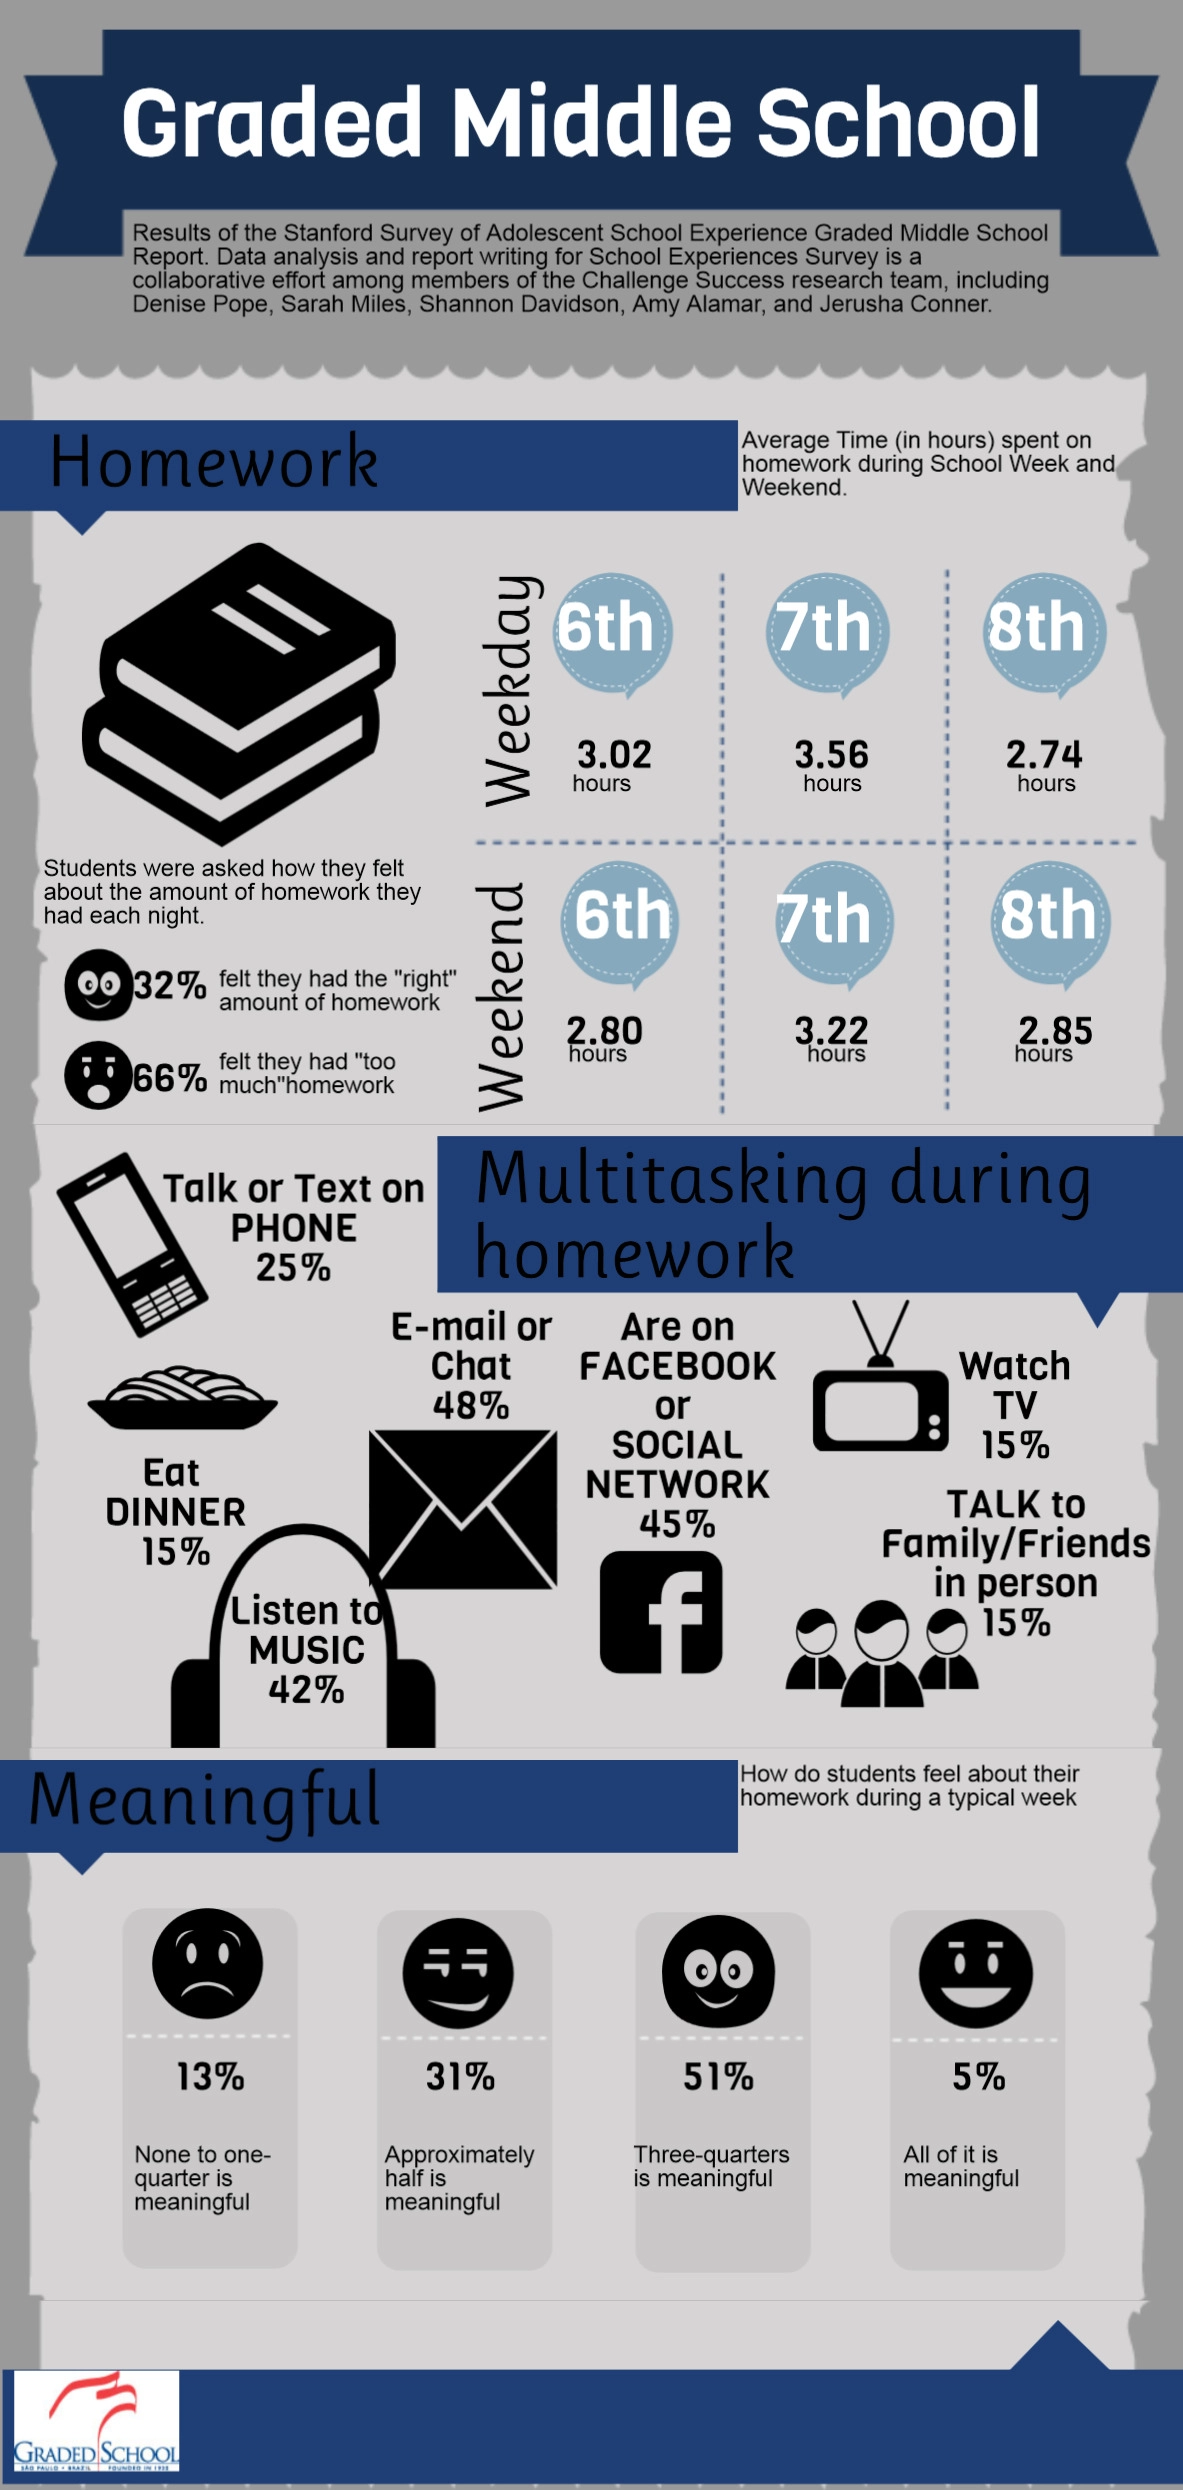
Laurel chose to give authentic, relevant and meaningful data (not invented data) to her students to analyze from the results of a Challenge Success survey taken the previous school year at the school. The survey compiled data about the school’s extra curricular activities, homework habits, parent involvement, student engagement, sleep patterns etc.
Laurel’s plan was to have students analyze the data and then create different types of graphs to be able to communicate their findings in a presentation. Students were to tell a story of the data. The rubric below showed students Laurel’s expectations in terms of content, communication/presentation and a blog post.
Laurel also made connections to standards clear:
The bottom of my rubric has the content standards for statistics and data, but Common Core also has 8 Mathematical Process standards and this project hits on a lot of them:
3. Construct viable arguments and critique the reasoning of others.
Make conjectures, justify conclusions, communicate them to others
4. Model with mathematics
Identify important quantities in a practical situation and map their relationships using diagrams, graphs,etc.
Analyze those relationships mathematically to draw conclusions
5. Use appropriate tools strategically
Be sufficiently familiar with tools appropriate to make sound decisions about whether these tools might be helpful, recognizing both the insight to be gained and their limitations.
Identify relevant external mathematical resources, such as digital content on a website, and use them to pose or solve problems.
Use technological tools to explore and deepen understanding of concepts.

Laurel, in her own words, lists some of the observations and comparison from teaching the same unit in previous years.
What is different this year?
I used real data that is relevant to them because I created a survey which they responded to and shared the results with the students and assigned each student a question/results to analyze.
I pulled all the parts of this unit into one project. Instead of making and analyzing graphs for one set of data (real or fake), finding and analyzing measures of central tendency for another (real or fake), creating and analyzing misleading graphs for another (real or fake), they do all of it for one real, relevant set of data.
I added the element of making the data tell a story- using it to communicate or persuade. Data and a narrative go best together.
I incorporated use of technology so they could share this on their blog not just with their classmates and the Graded community, but with a global community.
I dedicated a lot of class time for working on this and shared student work along the way so students could see exemplars and offer and receive feedback.
I designed specific questions for students to offer feedback on the projects on the blog posts.


From the perspective of modern skills and literacies upgrades:
Good teaching is good teaching. Adding technology to bad teaching still will not increase student learning. Adding technology to good teaching can add new layers and open up new dimensions of connections and learning. Laurel’s lesson on data analysis and graphing (including misleading graphs) was well planned, developed and executed to begin with. The lesson could have stood on its own and would have addressed the Math standards.
By tweaking the lesson, as Laurel described above, so many more instructional methods, skills, literacies and standards were addressed:
- making thinking visible
- being able to visually tell a story with data
- communicating that story via an electronic media for a larger audience (potential global connections)
- communicating math concepts
- going through creation cycle: data analysis, creation, sharing, publishing, feedback, revision
- differentiated
- personalized
- student choice
- media literacy: choose appropriate media, possibly “media/app smashing”, by mixing several tools/media to create one project
- network literacy: writing for an audience, receiving feedback, responding to feedback
- information literacy: analyzing data, recognizing misleading data, visualizing data, interpreting data from multiple perspectives
- digital citizenship: be aware of copyright of digital images (Creative Commons, proper citation)
Natasha, one of the sixth grade students summed up her experience in her blog post:
In math, we have been working on a project with data from the responses we got from the Challenge Success Survey. I thought that this project was extremely interesting because we got to incorporate our knowledge of most of the things we had learned about in that math unit. I really liked taking on my project from a different perspective. I also got to experiment with different websites that were really cool. I got to learn all about misleading graphs, graphs and so many other things that I hope you find as cool as I did.
Student examples (created in Wideo, Google Presentation, PowToon, Piktochart, Prezi) of presentations:
How Much Time are Graded 6th Graders Spending on Homework? by Maya W.
Come to Graded by Jack
Is it Fake or just Misleading? By Yael
Let’s Get into This by Rens
You Can Never Get Too Deep When it Comes to Data! by Tashi
Homework? Time? What’s Going on? by Laura
Do you do as much Homework as I do? by Alyssa
The Challenge is Complete by Felipe


Interested how this story continued to unfold? Watch for an upcoming blog post of Blogging in Math class, with student samples and model lesson video of Laurel introducing her expectations for quality blog commenting in Math.
Silvia Tolisano is a Curriculum21 faculty member, author of the book Digital Storytelling Tools for Educators and founder of the Around the World with 80 Schools project. Read more at http://langwitches.org/blog.
